Question 6 - Truck from Haifa
Distance-Time Graph Analysis
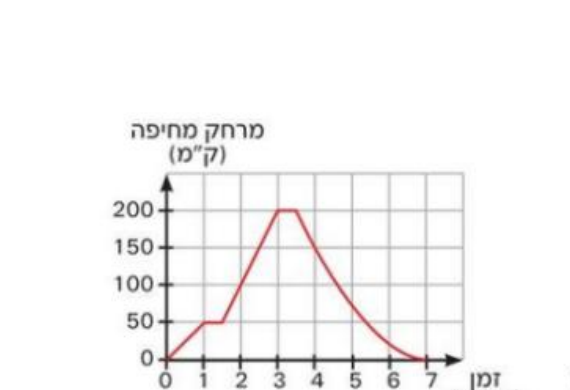
A truck left Haifa. During the trip it stopped twice.
The graph below describes the distance from Haifa as a function of time elapsed since the start of the trip.
The graph below describes the distance from Haifa as a function of time elapsed since the start of the trip.
The Graph
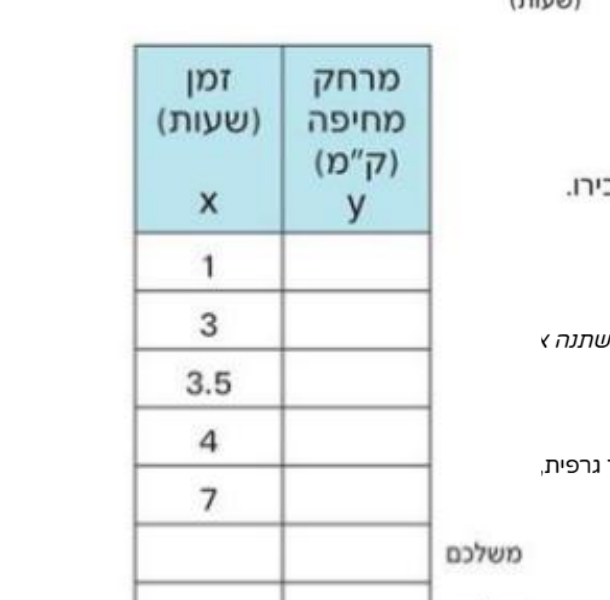
The Table
b. During which time intervals did the truck not travel? Explain.
Choose the correct answer:
c. Did the truck return to Haifa? Explain.
Choose the correct answer:
d. What was the maximum distance from Haifa during the trip?
Choose the correct answer:
e. Is it possible that at two different times the distance from Haifa was the same?
Choose the correct answer:
f. Is y (the distance) a one-to-one function of x (the time)?
Choose the correct answer:
Reminder: A one-to-one function is a function in which each y value corresponds to at most one x value.
In other words: every horizontal line intersects the graph at most at one point.